
Search for Indicators
Healthy People 2030 Progress Tracker
|
Healthy People 2030 is a comprehensive set of key disease prevention and health promotion objectives. The health objectives and targets allow communities to assess their health status and build an agenda for community health improvement. |
 |
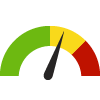
Indicator Gauge Icon Legend
Legend Colors
Red is bad, green is good, blue is not statistically different/neutral.
Compared to Distribution
 the value is in the best half of communities.
 the value is in the 2nd worst quarter of communities.
 the value is in the worst quarter of communities.
Compared to Target
 meets target;
  does not meet target.
Compared to a Single Value
 lower than the comparison value;
 higher than the comparison value;
 not statistically different from comparison value.
Trend

 non-significant change over time;
 significant change over time;
  no change over time.
Compared to Prior Value
 higher than the previous measurement period;
 lower than the previous measurement period;
 no statistically different change from previous measurement period.
Region: Rio Grande Valley
Health / Cancer
Value
Compared to:
Region: Rio Grande Valley Mammogram in Past 2 Years: 50-74
Region: Rio Grande Valley Mammogram in Past 2 Years: 50-74
67.9%
(2020)
Compared to:
HP 2030 Target
(80.3%)
Region: Rio Grande Valley
Health / Health Care Access & Quality
Value
Compared to:
Region: Rio Grande Valley Persons with Health Insurance
Region: Rio Grande Valley Persons with Health Insurance
69.7%
(2017)
Compared to:
HP 2030 Target
(92.4%)
<div>AHS-01: Increase the proportion of people with health insurance <strong>(LEADING HEALTH INDICATOR)</strong></div>
Region: Rio Grande Valley
Health / Heart Disease & Stroke
Value
Compared to:
Region: Rio Grande Valley Age-Adjusted Death Rate due to Cerebrovascular Disease (Stroke)
Region: Rio Grande Valley Age-Adjusted Death Rate due to Cerebrovascular Disease (Stroke)
27.0
Deaths per 100,000 population
(2018-2020)
Compared to:
HP 2030 Target
(33.4)
Region: Rio Grande Valley Age-Adjusted Death Rate due to Coronary Heart Disease
Region: Rio Grande Valley Age-Adjusted Death Rate due to Coronary Heart Disease
117.6
Deaths per 100,000 population
(2018-2020)
Compared to:
HP 2030 Target
(71.1)
Region: Rio Grande Valley High Blood Pressure Prevalence
Region: Rio Grande Valley High Blood Pressure Prevalence
33.7%
(2019)
Compared to:
HP 2030 Target
(41.9%)
Region: Rio Grande Valley
Health / Immunizations & Infectious Diseases
Value
Compared to:
Region: Rio Grande Valley Tuberculosis Incidence Rate
Region: Rio Grande Valley Tuberculosis Incidence Rate
25.2
Cases per 100,000 population
(2013-2017)
Compared to:
HP 2030 Target
(1.4)
Region: Rio Grande Valley
Health / Maternal, Fetal & Infant Health
Value
Compared to:
Region: Rio Grande Valley Infant Mortality Rate
Region: Rio Grande Valley Infant Mortality Rate
4.8
Deaths per 1,000 live births
(2015)
Compared to:
HP 2030 Target
(5.0)
<div>MICH-02: Reduce the rate of infant deaths <strong>(LEADING HEALTH INDICATOR)</strong></div>
Region: Rio Grande Valley Preterm Births
Region: Rio Grande Valley
Health / Mental Health & Mental Disorders
Value
Compared to:
Region: Rio Grande Valley Age-Adjusted Death Rate due to Suicide
Region: Rio Grande Valley Age-Adjusted Death Rate due to Suicide
7.0
Deaths per 100,000 population
(2018-2020)
Compared to:
HP 2030 Target
(12.8)
<div>MHMD-01: Reduce the suicide rate <strong>(LEADING HEALTH INDICATOR)</strong></div>
Region: Rio Grande Valley
Health / Physical Activity
Value
Compared to:
Region: Rio Grande Valley Adults who are Sedentary
Region: Rio Grande Valley
Health / Prevention & Safety
Value
Compared to:
Region: Rio Grande Valley Age-Adjusted Death Rate due to Unintentional Injuries
Region: Rio Grande Valley Age-Adjusted Death Rate due to Unintentional Injuries
24.0
Deaths per 100,000 population
(2018-2020)
Compared to:
HP 2030 Target
(43.2)
Region: Rio Grande Valley
Community / Crime & Crime Prevention
Value
Compared to:
Region: Rio Grande Valley Age-Adjusted Death Rate due to Homicide
Region: Rio Grande Valley Age-Adjusted Death Rate due to Homicide
3.3
Deaths per 100,000 population
(2018-2020)
Compared to:
HP 2030 Target
(5.5)
<div>IVP-09: Reduce homicides <strong>(LEADING HEALTH INDICATOR)</strong></div>
Region: Rio Grande Valley
Community / Public Safety
Value
Compared to:
Region: Rio Grande Valley Age-Adjusted Death Rate due to Motor Vehicle Traffic Collisions
Region: Rio Grande Valley Age-Adjusted Death Rate due to Motor Vehicle Traffic Collisions
9.4
Deaths per 100,000 population
(2018-2020)
Compared to:
HP 2030 Target
(10.1)
Region: Rio Grande Valley
Community / Transportation
Value
Compared to:
Region: Rio Grande Valley Workers Commuting by Public Transportation
Region: Rio Grande Valley Workers Commuting by Public Transportation
0.3%
(2018-2022)
Compared to:
HP 2030 Target
(5.3%)
Region: Rio Grande Valley
Economy / Poverty
Value
Compared to:
Region: Rio Grande Valley People Living Below Poverty Level
Region: Rio Grande Valley People Living Below Poverty Level
27.2%
(2018-2022)
Compared to:
HP 2030 Target
(8.0%)
