
Search for Indicators
Environmental Health
Use the drop-down menu to see data for different locations.
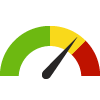
Indicator Gauge Icon Legend
Legend Colors
Red is bad, green is good, blue is not statistically different/neutral.
Compared to Distribution
 the value is in the best half of communities.
 the value is in the 2nd worst quarter of communities.
 the value is in the worst quarter of communities.
Compared to Target
 meets target;
  does not meet target.
Compared to a Single Value
 lower than the comparison value;
 higher than the comparison value;
 not statistically different from comparison value.
Trend

 non-significant change over time;
 significant change over time;
  no change over time.
Compared to Prior Value
 higher than the previous measurement period;
 lower than the previous measurement period;
 no statistically different change from previous measurement period.
County: Cameron
Environmental Health / Air
Value
Compared to:
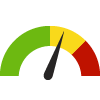
County: Cameron Annual Ozone Air Quality
County: Cameron Annual Ozone Air Quality
1
(2019-2021)
Compared to:
Air Quality Index
The American Lung Association (ALA) assigns grades A-F to counties (A=1; B=2; C=3; D=4; F=5), based on average annual number of days that ozone levels exceeded U.S. standards during the three year measurement period. The five-point grading scale was used for the distribution (Green = <2; Yellow = 2 - 3; Red = >3). The air quality data is collected by the EPA and summarized by the ALA.
Prior Value
(1)
Prior Value compares a measured value with the previously measured value. Confidence intervals were not taken into account in determining the direction of the comparison.
Trend
This comparison measures the indicator’s values over multiple time periods.<br>The Mann-Kendall Test for Statistical Significance is used to evaluate the trend<br>over 4 to 10 periods of measure, subject to data availability and comparability.
County: Cameron Annual Particle Pollution
County: Cameron Annual Particle Pollution
5
(2019-2021)
Compared to:


Air Quality Index
The American Lung Association (ALA) assigns grades A-F to counties (A=1; B=2; C=3; D=4; F=5), based on average annual number of days that particle pollution levels exceeded U.S. standards during the three year measurement period. The five-point grading scale was used for the distribution (Green = <2; Yellow = 2 - 3; Red = >3). The air quality data is collected by the EPA and summarized by the ALA.
Prior Value
(5)
Prior Value compares a measured value with the previously measured value. Confidence intervals were not taken into account in determining the direction of the comparison.
Trend
This comparison measures the indicator’s values over multiple time periods.<br>The Mann-Kendall Test for Statistical Significance is used to evaluate the trend<br>over 4 to 10 periods of measure, subject to data availability and comparability.
County: Cameron Recognized Carcinogens Released into Air
County: Cameron Recognized Carcinogens Released into Air
13,659
Pounds
(2022)
Compared to:
Prior Value
(15,708)
Prior Value compares a measured value with the previously measured value. Confidence intervals were not taken into account in determining the direction of the comparison.
Trend
This comparison measures the indicator’s values over multiple time periods.<br>The Mann-Kendall Test for Statistical Significance is used to evaluate the trend<br>over 4 to 10 periods of measure, subject to data availability and comparability.
County: Cameron
Environmental Health / Built Environment
Value
Compared to:
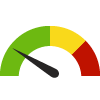
County: Cameron Access to Exercise Opportunities
County: Cameron Access to Exercise Opportunities
74.5%
(2024)
Compared to:

TX Counties
The distribution is based on data from 243 Texas counties.
U.S. Counties
The distribution is based on data from 3,096 U.S. counties and county equivalents.
TX Value
(81.8%)
The regional value is compared to the Texas State value.
US Value
(84.1%)
The regional value is compared to the national value.
Prior Value
(67.0%)
Prior Value compares a measured value with the previously measured value. Confidence intervals were not taken into account in determining the direction of the comparison.
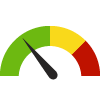
County: Cameron Access to Parks
County: Cameron Access to Parks
47.0%
(2020)
Compared to:
TX Counties
The distribution is based on data from 254 Texas counties.
TX Value
(62.8%)
The regional value is compared to the Texas State value.
Prior Value
(27.1%)
Prior Value compares a measured value with the previously measured value. Confidence intervals were not taken into account in determining the direction of the comparison.
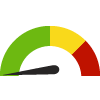
County: Cameron Food Environment Index
County: Cameron Food Environment Index
5.1
(2024)
Compared to:


TX Counties
The distribution is based on data from 253 Texas counties.
U.S. Counties
The distribution is based on data from 3,108 U.S. counties and county equivalents.
TX Value
(5.9)
The regional value is compared to the Texas State value.
US Value
(7.7)
The regional value is compared to the national value.
Prior Value
(5.4)
Prior Value compares a measured value with the previously measured value. Confidence intervals were not taken into account in determining the direction of the comparison.
Trend
This comparison measures the indicator’s values over multiple time periods.<br>The Mann-Kendall Test for Statistical Significance is used to evaluate the trend<br>over 4 to 10 periods of measure, subject to data availability and comparability.
County: Cameron Liquor Store Density
County: Cameron Liquor Store Density
4.5
Stores per 100,000 population
(2021)
Compared to:

TX Counties
(2016)
The distribution is based on data from 184 Texas counties.
U.S. Counties
The distribution is based on data from 1,477 U.S. counties and county equivalents.
TX Value
(7.2)
The regional value is compared to the Texas State value.
US Value
(10.7)
The regional value is compared to the national value.
Rio Grande Valley Regional Value
(3.8)
The regional value is compared to the Rio Grande Valley Region value.
Prior Value
(5.2)
Prior Value compares a measured value with the previously measured value. Confidence intervals were not taken into account in determining the direction of the comparison.
Trend
This comparison measures the indicator’s values over multiple time periods.<br>The Mann-Kendall Test for Statistical Significance is used to evaluate the trend<br>over 4 to 10 periods of measure, subject to data availability and comparability.
County: Cameron Proximity to Highways
County: Cameron Proximity to Highways
4.5%
(2020)
Compared to:
TX Counties
The distribution is based on data from 254 Texas counties.
TX Value
(6.5%)
The regional value is compared to the Texas State value.
Prior Value
(4.8%)
Prior Value compares a measured value with the previously measured value. Confidence intervals were not taken into account in determining the direction of the comparison.
County: Cameron
Environmental Health / Toxins & Contaminants
Value
Compared to:
County: Cameron Houses Built Prior to 1950
County: Cameron Houses Built Prior to 1950
4.5%
(2018-2022)
Compared to:
TX Counties
The distribution is based on data from 254 Texas counties.
U.S. Counties
The distribution is based on data from 3,133 U.S. counties and county equivalents.
TX Value
(6.2%)
The regional value is compared to the Texas State value.
US Value
(16.7%)
The regional value is compared to the national value.
Rio Grande Valley Regional Value
(3.1%)
The regional value is compared to the Rio Grande Valley Region value.
Trend
This comparison measures the indicator’s values over multiple time periods.<br>The Mann-Kendall Test for Statistical Significance is used to evaluate the trend<br>over 4 to 10 periods of measure, subject to data availability and comparability.
County: Cameron PBT Released
County: Cameron PBT Released
13,532
Pounds
(2022)
Compared to:

Prior Value
(3,488)
Prior Value compares a measured value with the previously measured value. Confidence intervals were not taken into account in determining the direction of the comparison.
Trend
This comparison measures the indicator’s values over multiple time periods.<br>The Mann-Kendall Test for Statistical Significance is used to evaluate the trend<br>over 4 to 10 periods of measure, subject to data availability and comparability.
County: Cameron
Environmental Health / Weather & Climate
Value
Compared to:
County: Cameron Daily Dose of UV Irradiance
County: Cameron Daily Dose of UV Irradiance
4,658.0
Joule per square meter
(2020)
Compared to:

TX Counties
The distribution is based on data from 254 Texas counties.
TX Value
(4,529.0)
The regional value is compared to the Texas State value.
Prior Value
(4,456.0)
Prior Value compares a measured value with the previously measured value. Confidence intervals were not taken into account in determining the direction of the comparison.
Trend
This comparison measures the indicator’s values over multiple time periods.<br>The Mann-Kendall Test for Statistical Significance is used to evaluate the trend<br>over 4 to 10 periods of measure, subject to data availability and comparability.
County: Cameron Number of Extreme Heat Days
County: Cameron Number of Extreme Heat Days
2
Days
(2021)
Compared to:
Prior Value
(23)
Prior Value compares a measured value with the previously measured value. Confidence intervals were not taken into account in determining the direction of the comparison.
Trend
This comparison measures the indicator’s values over multiple time periods.<br>The Mann-Kendall Test for Statistical Significance is used to evaluate the trend<br>over 4 to 10 periods of measure, subject to data availability and comparability.
County: Cameron Number of Extreme Heat Events
County: Cameron Number of Extreme Heat Events
0
Events
(2021)
Compared to:
Prior Value
(20)
Prior Value compares a measured value with the previously measured value. Confidence intervals were not taken into account in determining the direction of the comparison.
Trend
This comparison measures the indicator’s values over multiple time periods.<br>The Mann-Kendall Test for Statistical Significance is used to evaluate the trend<br>over 4 to 10 periods of measure, subject to data availability and comparability.
County: Cameron Number of Extreme Precipitation Days
County: Cameron Number of Extreme Precipitation Days
15
Days
(2021)
Compared to:
Prior Value
(6)
Prior Value compares a measured value with the previously measured value. Confidence intervals were not taken into account in determining the direction of the comparison.
Trend
This comparison measures the indicator’s values over multiple time periods.<br>The Mann-Kendall Test for Statistical Significance is used to evaluate the trend<br>over 4 to 10 periods of measure, subject to data availability and comparability.
County: Cameron Weeks of Moderate Drought or Worse
County: Cameron Weeks of Moderate Drought or Worse
20
Weeks per year
(2021)
Compared to:
Prior Value
(22)
Prior Value compares a measured value with the previously measured value. Confidence intervals were not taken into account in determining the direction of the comparison.
Trend
This comparison measures the indicator’s values over multiple time periods.<br>The Mann-Kendall Test for Statistical Significance is used to evaluate the trend<br>over 4 to 10 periods of measure, subject to data availability and comparability.
