
Search for Indicators
Diabetes & Pre-Diabetes Dashboard
Use the drop down menu below to change geographies. Different data may be available at different locations.
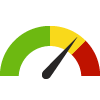
Indicator Gauge Icon Legend
Legend Colors
Red is bad, green is good, blue is not statistically different/neutral.
Compared to Distribution
 the value is in the best half of communities.
 the value is in the 2nd worst quarter of communities.
 the value is in the worst quarter of communities.
Compared to Target
 meets target;
  does not meet target.
Compared to a Single Value
 lower than the comparison value;
 higher than the comparison value;
 not statistically different from comparison value.
Trend

 non-significant change over time;
 significant change over time;
  no change over time.
Compared to Prior Value
 higher than the previous measurement period;
 lower than the previous measurement period;
 no statistically different change from previous measurement period.
Region: Rio Grande Valley
Health / Diabetes
Value
Compared to:
Region: Rio Grande Valley Adults with Prediabetes
Region: Rio Grande Valley Adults with Prediabetes
11.3%
(2015)
Compared to:

TX Value
(7.5%)
The regional value is compared to the Texas State value.
Prior Value
(4.8%)
Prior Value compares a measured value with the previously measured value. Confidence intervals were taken into account in determining the direction of the comparison.
Region: Rio Grande Valley Adults who have been Tested for High Blood Sugar or Diabetes: Past 3 Years
Region: Rio Grande Valley Adults who have been Tested for High Blood Sugar or Diabetes: Past 3 Years
48.1%
(2016)
Compared to:


TX Value
(55.6%)
The regional value is compared to the Texas State value.
Prior Value
(48.4%)
Prior Value compares a measured value with the previously measured value. Confidence intervals were taken into account in determining the direction of the comparison.
Trend
This comparison measures the indicator’s values over multiple time periods.<br>The Mann-Kendall Test for Statistical Significance is used to evaluate the trend<br>over 4 to 10 periods of measure, subject to data availability and comparability.
Region: Rio Grande Valley Diabetes: Medicare Population
Region: Rio Grande Valley Diabetes: Medicare Population
43.1%
(2018)
Compared to:

TX Counties
The distribution is based on data from 252 Texas counties.
U.S. Counties
The distribution is based on data from 3,143 U.S. counties and county equivalents.
TX Value
(28.8%)
The regional value is compared to the Texas State value.
US Value
(27.0%)
The regional value is compared to the national value.
Prior Value
(43.2%)
Prior Value compares a measured value with the previously measured value. Confidence intervals were not taken into account in determining the direction of the comparison.
Trend
This comparison measures the indicator’s values over multiple time periods.<br>The Mann-Kendall Test for Statistical Significance is used to evaluate the trend<br>over 4 to 10 periods of measure, subject to data availability and comparability.
Region: Rio Grande Valley Age-Adjusted Death Rate due to Diabetes
Region: Rio Grande Valley Age-Adjusted Death Rate due to Diabetes
33.3
Deaths per 100,000 population
(2018-2020)
Compared to:


TX Counties
The distribution is based on data from 133 Texas counties.
U.S. Counties
The distribution is based on data from 1,937 U.S. counties and county equivalents.
TX Value
(23.8)
The regional value is compared to the Texas State value.
US Value
(22.6)
The regional value is compared to the national value.
Prior Value
(29.3)
Prior Value compares a measured value with the previously measured value. Confidence intervals were taken into account in determining the direction of the comparison.
Trend
This comparison measures the indicator’s values over multiple time periods.<br>The Mann-Kendall Test for Statistical Significance is used to evaluate the trend<br>over 4 to 10 periods of measure, subject to data availability and comparability.
Region: Rio Grande Valley
Health / Physical Activity
Value
Compared to:
Region: Rio Grande Valley Adults who are Sedentary
Region: Rio Grande Valley Adults who are Sedentary
33.5%
(2020)
Compared to:
US Value
(23.5%)
The regional value is compared to the national value.
HP 2030 Target
(21.8%)
